| Search | | People | | Calendar | | Internal Resources | | Home |

Crustal Deformation and Fault Mechanics |
 |
|
|||||||||
|
|
||||||||
|
Migration of Tremor and Slip in CascadiaThe Cascadia subduction zone, where the
Juan de Fuca
tectonic plate converges with the North American tectonic
plate, hosts
magnitude 8-9+ megathrust earthquakes with an inter-event
time estimated to be
300-500 years.
The last such
earthquake occurred on January 26, 1700 and had an
estimated magnitude of
9. In
between these earthquakes
the subduction zone is not quiescent, but rather hosts
repeating slow slip
events and tectonic tremor, together referred to as
Episodic Tremor and Slip (ETS). ETS occurs on the deep extent of the
plate interface, deeper than the main earthquake region,
and repeats with intervals
in the range of 1-2 years depending on location. ETS is composed of slow slip on the
plate interface, at the
rate of about 2 mm/day, and small low-frequency seismic
signals called
tremor. The
combined moment of the
recorded tremor from seismic stations is much smaller than
the total moment of
slip recorded by GPS stations, implying that much of the
plate interface is
slipping aseismically.
This slow
aseismic slip is recorded on the surface as ~1cm
displacements on a network of
GPS stations. Studying ETS contributes to our general
understanding of
subduction since it has been detected in multiple places
around the world. In
particular, it is debated whether a
large megathrust would rupture into the ETS region, or
stop updip. Further
understanding of the physics of
ETS is needed to answer this question.
If the megathrust does rupture into this region,
the shaking in cities
near the coast such as Seattle and Portland will be
greater. In
addition, since ETS occurs
frequently, it provides an opportunity to monitor for
changes in the subduction
zone. It is
possible that ETS
monitoring may give us a recognizable precursor to any
large earthquake, but we
don’t yet understand ETS well enough to know. Noel Bartlow has been working on
contributing to the
understanding of ETS by studying how slip and tremor
migrate during an ETS
event. Although it is established that ETS is composed
aseismic slip and
tremor, which is in turn composed of individual small
low-frequency
earthquakes, the relationship between these two components
is not well
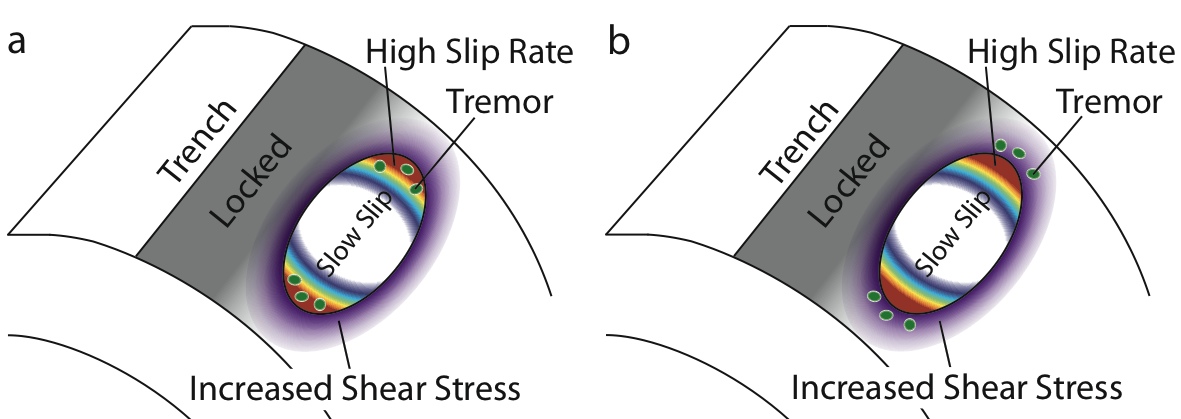
understood. Many
researchers have proposed
a model of a freely slipping interface with individual
“stuck” patches
representing tremor sources. These
patches are loaded by the slip until they “pop” giving off
seismic waves (see
Figure 1).
Figure
1. Schematic
diagrams of two possible
relationships between tremor and slow slip.
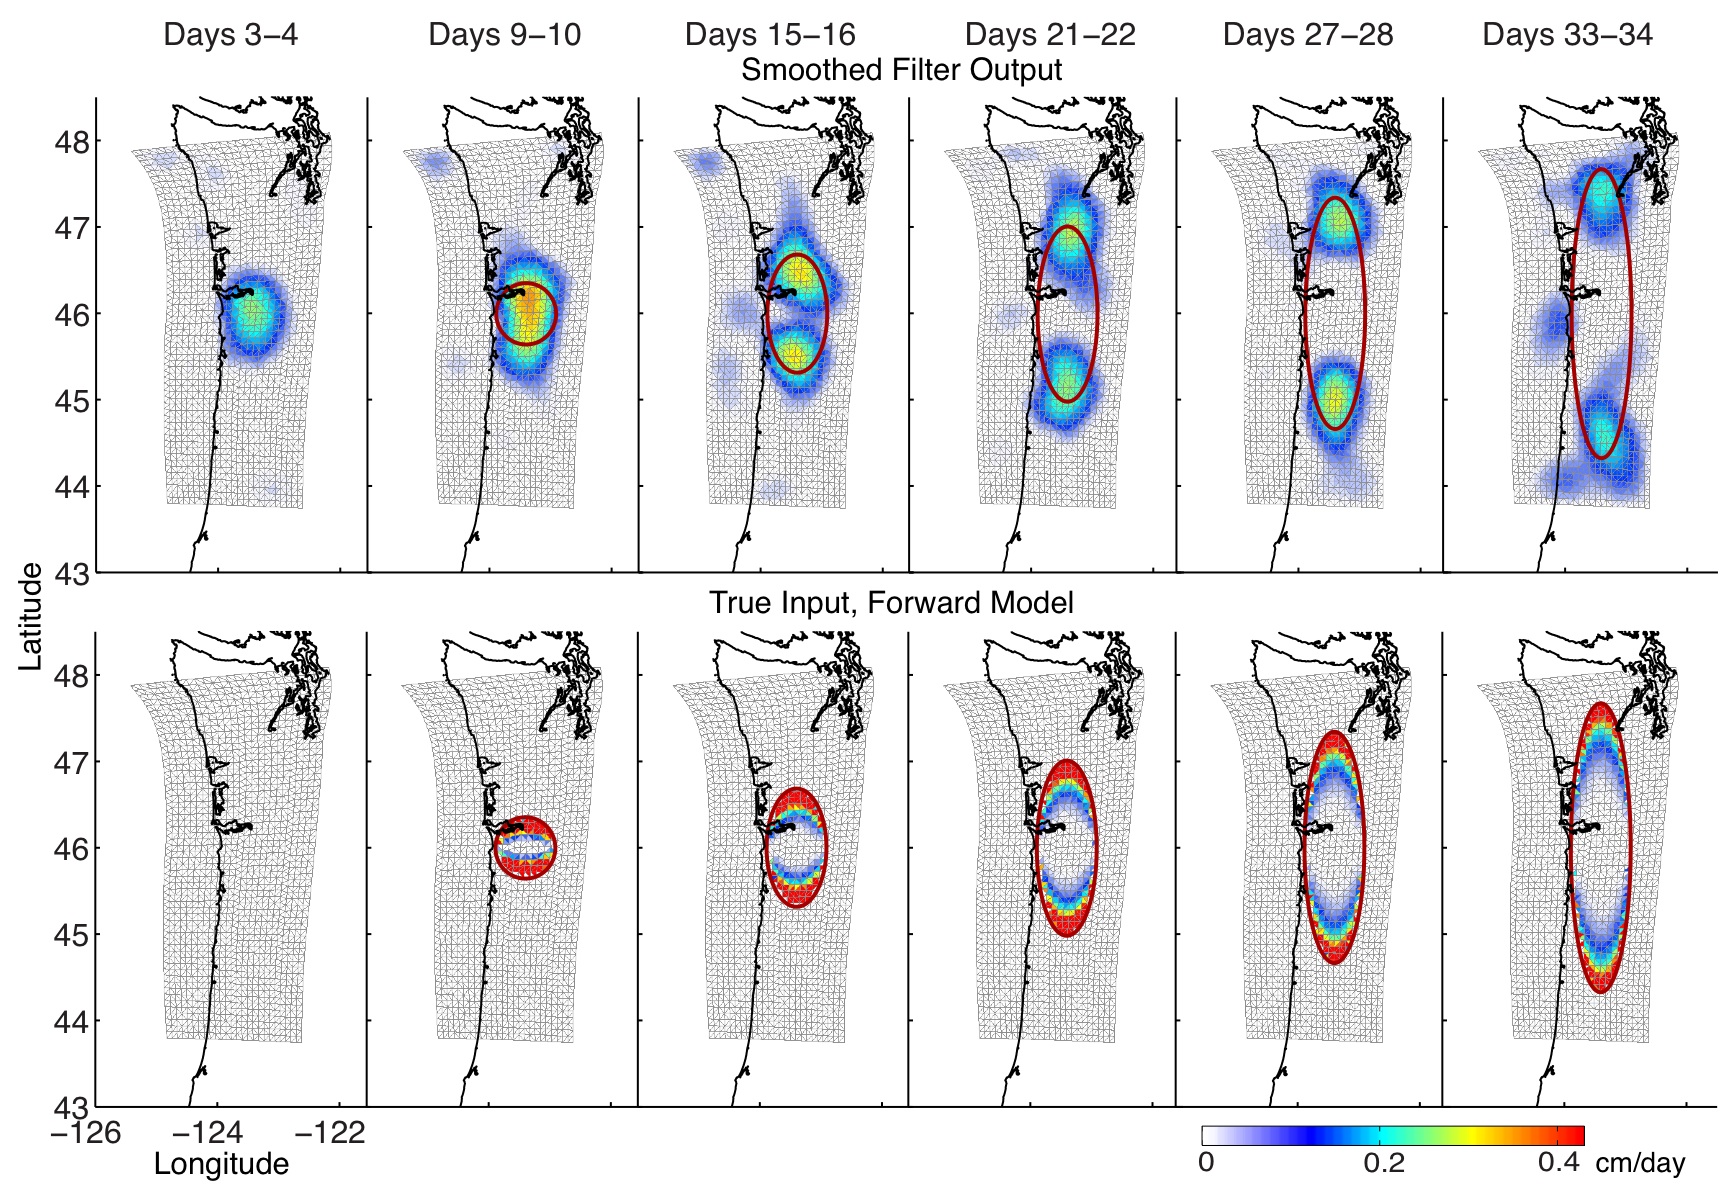
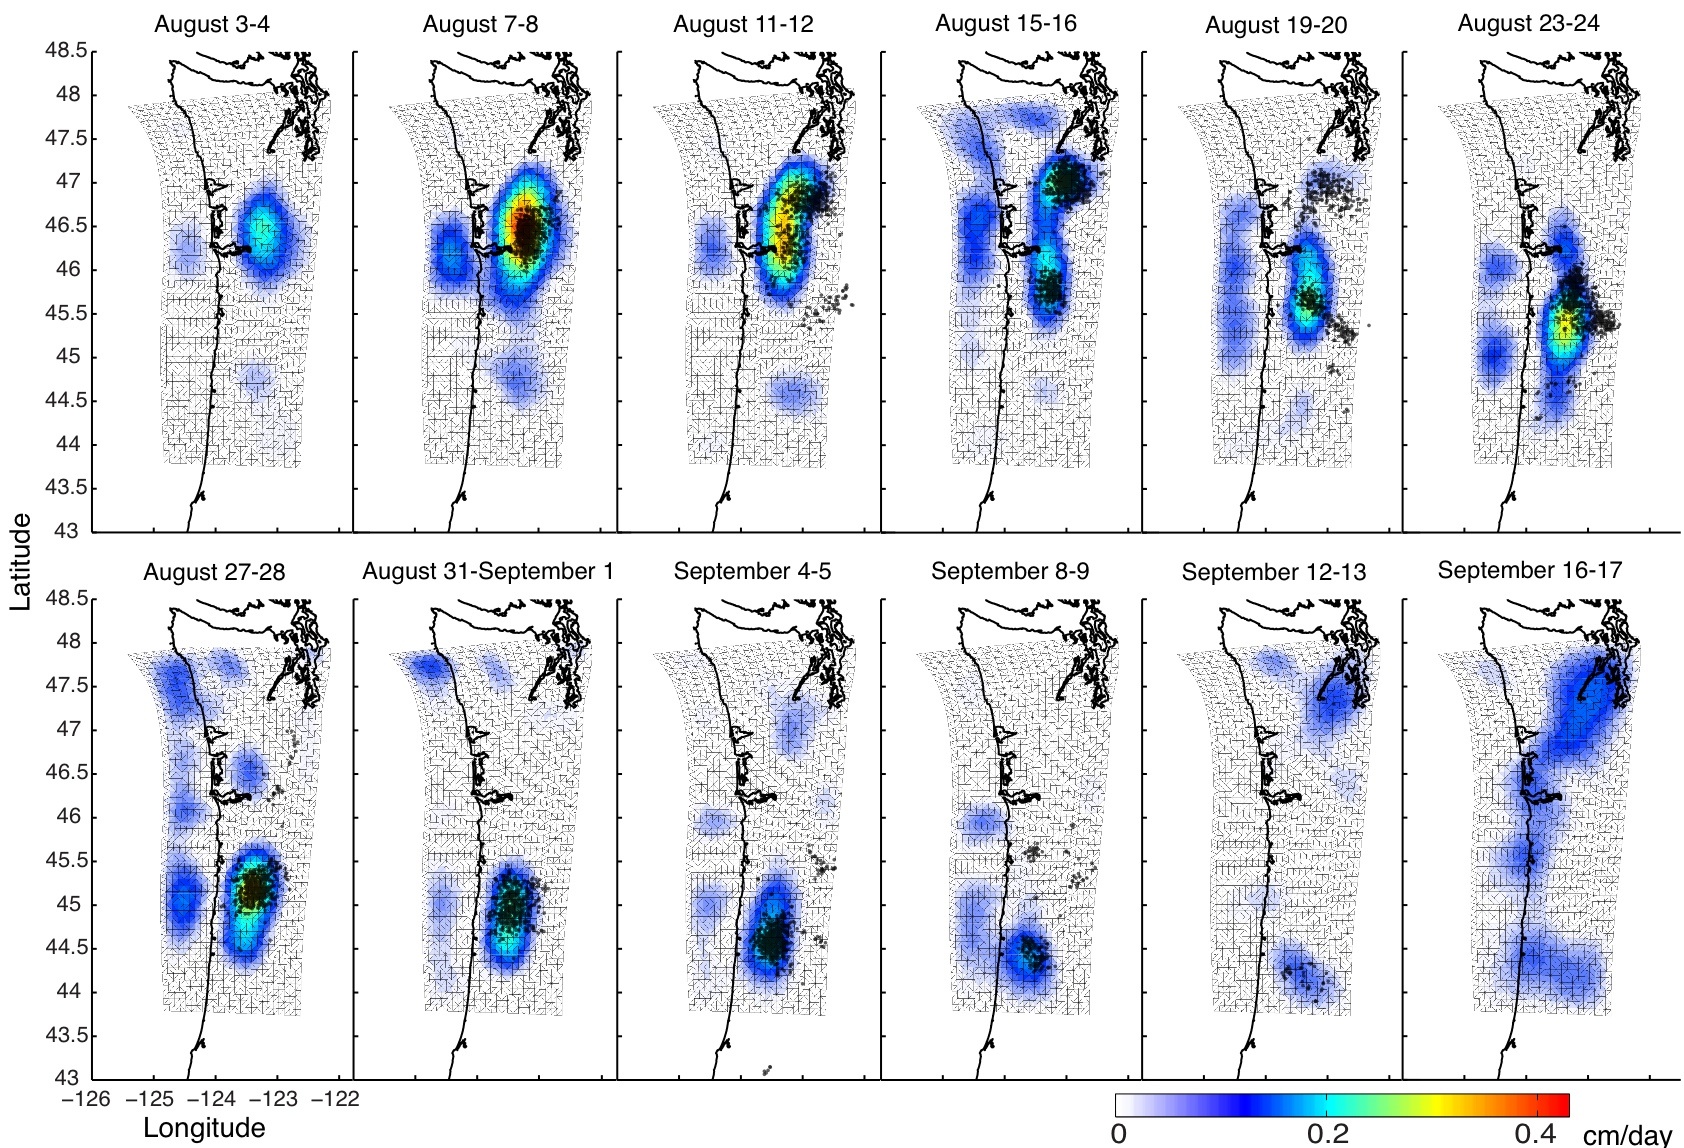 Figure
2.
Slip
rate on the plate
interface, averaged over two day intervals. Tremor
epicenters are plotted in
black for the same two-day intervals. The plate
interface mesh is shown between
10 and 60 km depth. Note that not all of the modeled
days are shown.
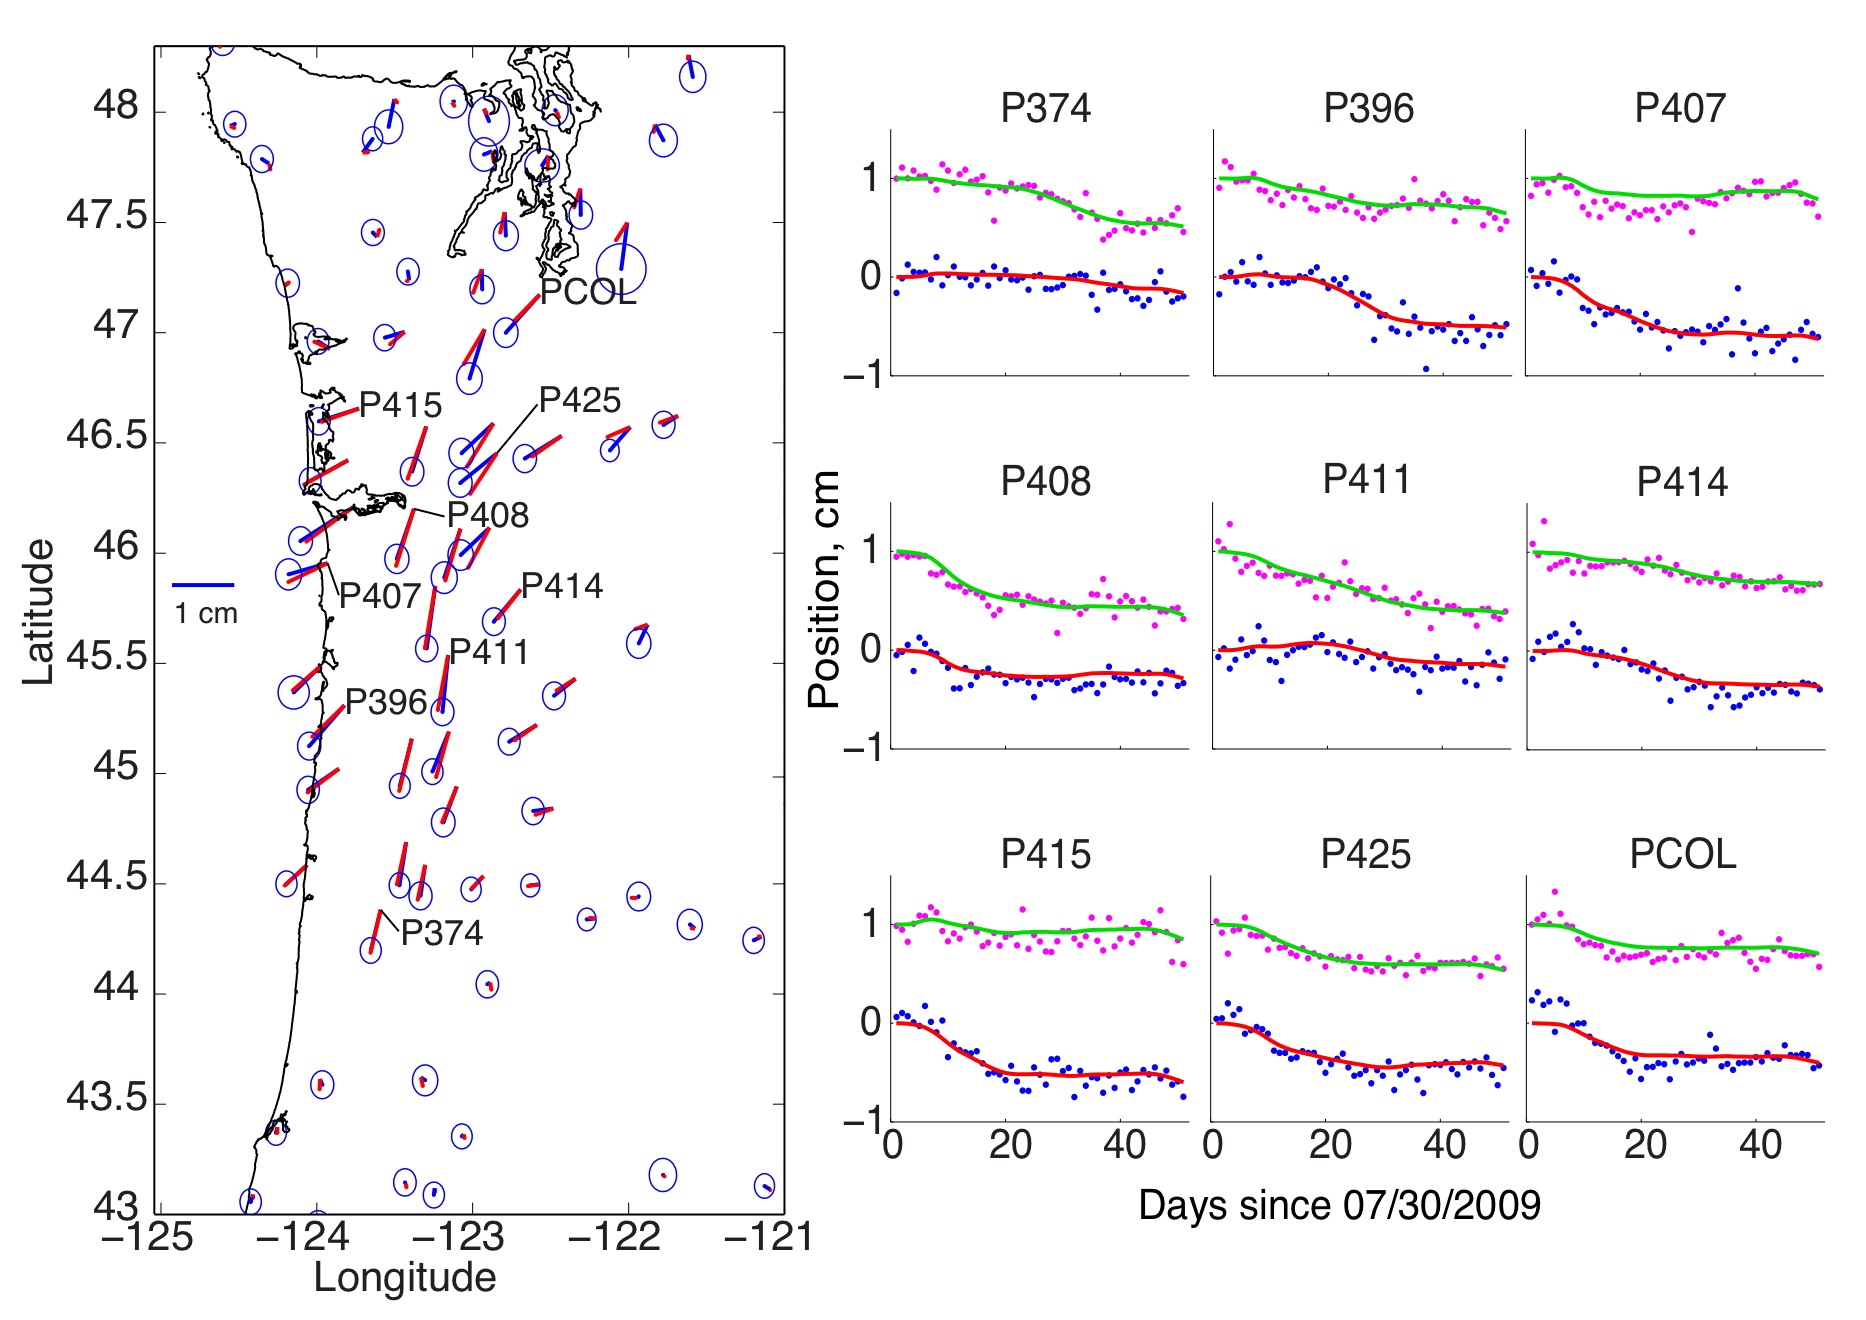
Figure 3. Left: Observed and predicted
cumulative GPS displacements during the 2009 ETS
event. Data and 1σ error ellipses shown in blue; model fit
shown in red. Labeled stations refer to time series fits shown
to the right. Right: Time series fits to GPS data
for selected stations.
|
| Last modified
Please contact the webmaster with suggestions or comments. |
|